
Juan Martín Marcenaro
Thursday, August 15, 2024
GEE Python API and CHIRPS: Analyzing precipitation in Buenos Aires - Part 2
Project Overview
In this post, we continue our exploration of the 2023 severe drought in Buenos Aires province, Argentina. In our previous post, we used the CHIRPS dataset to analyze the extent and impact of the drought. Now, we’ll take our analysis a step further by extracting time series data from specific coordinates within the affected region.
To ensure that you can follow along and reproduce the results, all the code used in this analysis is available in my GitHub repository.
Analysis
We’ll start by calling the necessary libraries, initializing GEE, and setting our point of interest—specifically chosen for experiencing the most severe drought conditions during this period.
# Libraries
import pandas as pd
import numpy as np
import matplotlib.pyplot as plt
import ee
from tqdm import tqdm

# Initialize earth engine
ee.Initialize()

# Define POI (coordinates of interest)
POI = ee.Geometry.Point([-60.92069,-34.57511])
Next up, we’ll define a dictionary of image collections, one for each year in the 1981-2023 period. Since we’re working with a point object, the code will return only the values associated with the nearest pixel.
# Create a dictionary of image collections (one for every year)
DICT_CHIRPS_01 = {}

for YEAR in range (1981, 2024):

    DATE_START = f"{YEAR}-01-01"
    DATE_END = f"{YEAR+1}-01-01"

    DICT_CHIRPS_01[f"{YEAR}"] = ee.ImageCollection("UCSB-CHG/CHIRPS/DAILY") \
                        .filterBounds(POI) \
                        .filterDate(DATE_START, DATE_END)
In the following step, we’ll calculate the mean over the POI (even though it’s a single pixel) and append the daily precipitation values to a dictionary of lists, one for each year.
# Store daily precipitation for each year
DICT_CHIRPS_02 = {}

# Get spatial resolution
OS = DICT_CHIRPS_01["1981"].first().projection().nominalScale().getInfo()

for k, IC in tqdm(DICT_CHIRPS_01.items()):

    # Compute daily ppt on every image
    _ = IC.map(lambda image: image.set('precipitation',\
                                                   image.reduceRegion(reducer=ee.Reducer.mean(), geometry=POI, scale=OS)\
                                                   .get('precipitation')
                                                   ))

    # Daily ppt to list
    P_L = _.aggregate_array('precipitation').getInfo()

    DICT_CHIRPS_02[f"{k}"] = P_L
With this dictionary, we’ll then create another dictionary of pandas DataFrames. Each DataFrame will contain daily and cumulative precipitation values for each year.
# Turn each list into a dataframe
DICT_CHIRPS_03 = {}

for k, L in DICT_CHIRPS_02.items():

    DICT_CHIRPS_03[f"{k}"] = pd.DataFrame(data={"PPT" : L})

    # Calculate cumultive PPT
    DICT_CHIRPS_03[f"{k}"]["CUM"] = DICT_CHIRPS_03[f"{k}"]["PPT"].cumsum()
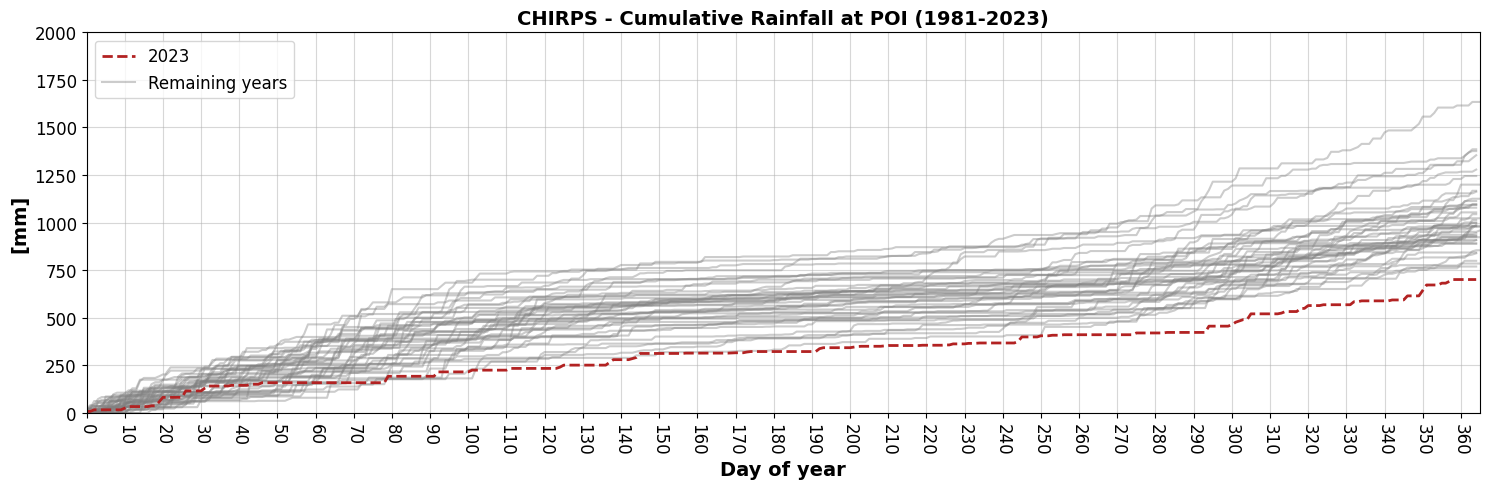
Finally, we can now visualize the results to compare precipitation trends throughout the year and assess the severity of the 2023 drought scenario against historical records.
# Plot cumulative precipitation of every year
fig, ax = plt.subplots(figsize=(15, 5))


for k, DF in DICT_CHIRPS_03.items():

    if k != "2023":

        ax.plot(DF["CUM"], c="gray", alpha=.4)

    else:

        ax.plot(DF["CUM"], c="firebrick", linewidth=2, linestyle="dashed", label="2023")

ax.set_title("CHIRPS - Cumulative Rainfall at POI (1981-2023)", fontweight="bold", fontsize=14)
ax.set_ylabel("[mm]", fontweight="bold", fontsize=14)
ax.set_xlabel("Day of year", fontweight="bold", fontsize=14)

ax.grid(alpha=.5)

ax.set_ylim(0, 2000)
ax.set_xlim(0, 365)
ax.set_xticks(range(0, 360+10, 10))
ax.tick_params(which="both", labelsize=12)
ax.tick_params(axis='x', rotation=-90)


_, = plt.plot([], [], label="Remaining years", linestyle='-', color='gray', alpha=.4)
plt.legend(handles=[_], loc="upper left")
ax.legend(loc="upper left", fontsize=12)


fig.tight_layout()
plt.show();
Conclusion
As observed, the year started with precipitation values within the expected range. However, around day 80, drought conditions began to develop and persisted throughout the year, culminating in the most severe drought recorded during this period.
The mean annual rainfall for the entire period from 1981 to 2023 is 1029.3 mm. In contrast, the total rainfall for 2023 was only 701.1 mm—approximately 300 mm less than the average. This significant deficit in precipitation had severe implications for agriculture, making it crucial to quantify these values to understand and assess the impact on crop yields.
This post marks the end of our series on analyzing the 2023 severe drought in Buenos Aires province using the CHIRPS dataset. We specifically focused on a set of coordinates where the drought’s impact was most severe. Leveraging the capabilities of the GEE Python API, along with tools like Geopandas, Rasterio, and Matplotlib, we thoroughly examined and visualized the data.